

Key Takeaway
-
Replaces guesswork with hard data on views, watch time, and engagement to optimize your content strategy.
-
Identifies which specific elements—such as thumbnails, titles, and demographics—actually drive audience retention and subscriptions.
-
Helps track seasonal trends and audience behavior to build a long-term roadmap for scaling and monetization.
-
Leverages the native YouTube Studio dashboard alongside third-party tools (VidIQ, TubeBuddy) for advanced SEO and competitor research.
What Is YouTube Analytics and Why It Matters
YouTube Analytics is an all-in-one, native analytics solution in the YouTube Studio that monitors the performance of channels based on metrics such as views, watch time, subscribers, and demographics. This is an essential tool because it enables creators to monitor viewer behavior, improve content strategies, optimize thumbnails to increase click-through rates, and monitor earnings.
Key aspects of YouTube Analytics:
- Core Metrics: Monitors views, subscription numbers, and watch time, which is an important engagement metric.
- Audience Insights: Breaks down demographics (age, gender, geography), interests, and devices to assist in content optimization.
- Content Performance: Reports viewer engagement with videos, including average view time, retention rate, and engagement metrics such as likes and shares.
- Traffic Sources: Reveals how viewers are accessing videos (e.g., YouTube search results, suggested videos, or other websites).
- Revenue Tracking: Partners will see ad revenue, membership, and other monetization strategies.
- Real-Time Data: Offers real-time, minute-by-minute data, although it is not the only area of interest.
Why It Matters
- Data-Driven Decisions: Assists creators in knowing what kind of content performs well.
- Content Optimization: Helps in understanding where the audience is dropping off, thus assisting in optimizing content.
- Audience Growth: Shows when the audience is most engaged, thus assisting in scheduling content.
- SEO Improvement: Assists in understanding what search terms are being used to access the content, thus improving video titles and descriptions.
- Benefits of keeping track of YouTube Analytics
How to Access YouTube Analytics
Getting to your YouTube Analytics is easy, whether you are on a computer or a mobile device.
Accessing on Desktop (YouTube Studio)
To access your YouTube Analytics on your computer, follow these steps:
- Click on your profile picture in the top right corner of the screen.
- Select ‘YouTube Studio’ from the dropdown menu.
- Click on ‘Analytics’ from the left-hand menu.
This will direct you to your primary analytics page, which will display an overview of your channel’s performance.
Accessing on Mobile (YouTube Studio App)
To access your YouTube Analytics on your mobile device, follow these steps:
- Download the YouTube Studio app on your smartphone or tablet.
- Open the YouTube Studio app.
- Log in with your YouTube account.
- Tap on ‘Analytics’ from the bottom menu or the left-hand menu (depending on the app version).
The YouTube Studio app is a great way to keep track of your latest video and channel performance on the go.
Understanding Key Metrics in the YouTube Analytics Tabs
YouTube Analytics breaks down its massive amount of data into a number of easy-to-use tabs, each of which provides a different insight into your channel’s performance.
1. The Overview Tab
This is a summary of your channel’s performance, giving you a quick look at the most important information.
Top videos: The overview tab also displays your top-performing videos so far.
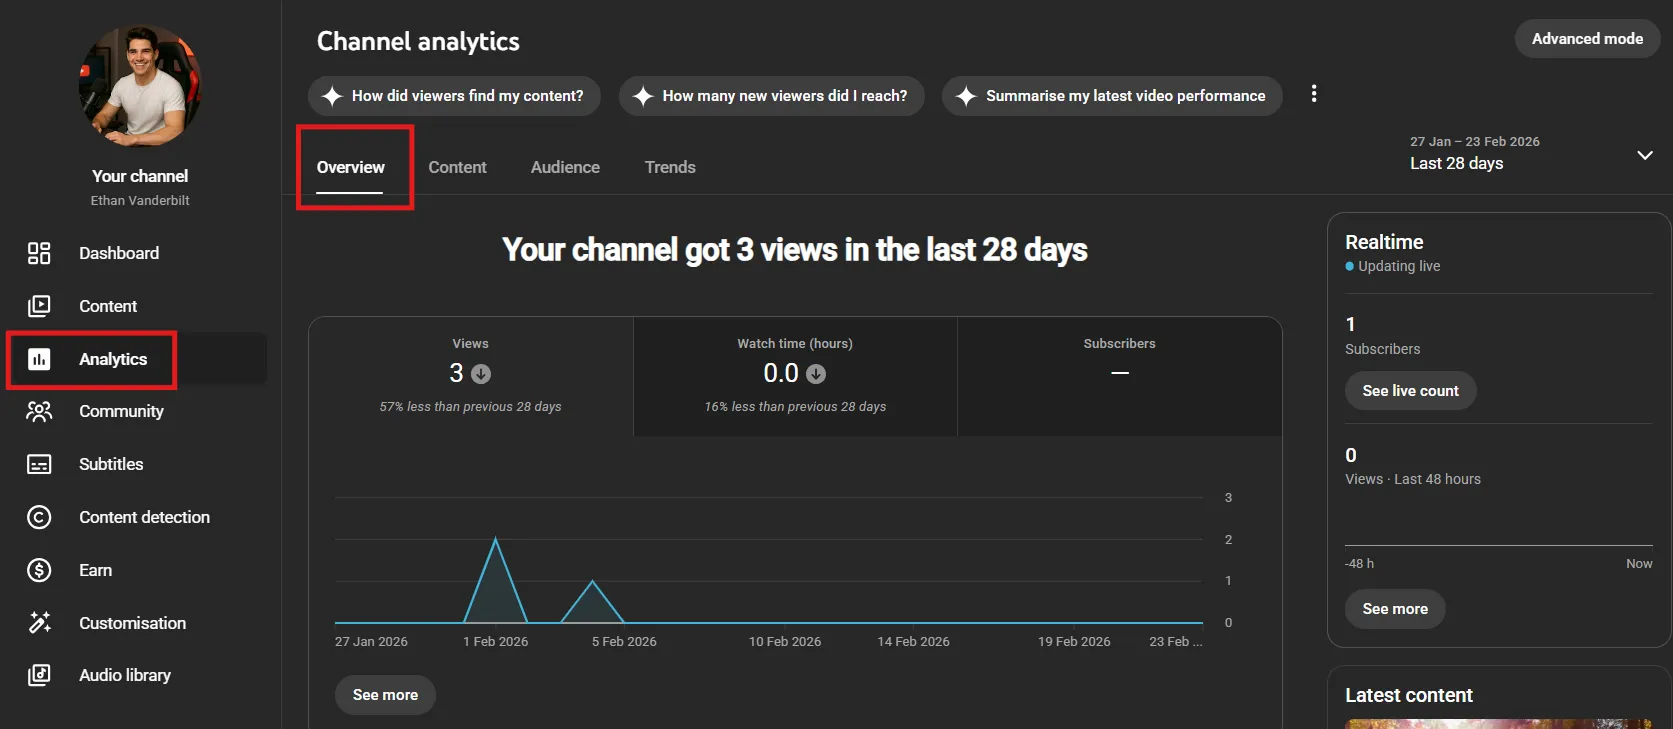
- Views: This metric will give you the number of times people have accessed your channel and viewed it within a chosen period of time. The minimum viewing time of the video is based on the video length. Typically, 30 seconds is the standard minimum view.
- Watch time: The watch time metric provides an overall figure that shows the total number of hours for which viewers have watched your channel.
- Subscribers: The subscribers metric is calculated by subtracting the number of subscribers lost from the number of subscribers gained.
- Real-time views: This metric will give you the number of people who have accessed your video within the last 48 hours. This information is constantly updated in real-time.
- Top videos: The overview tab will also give you the best-performing videos so far.
2. Real Time Performance
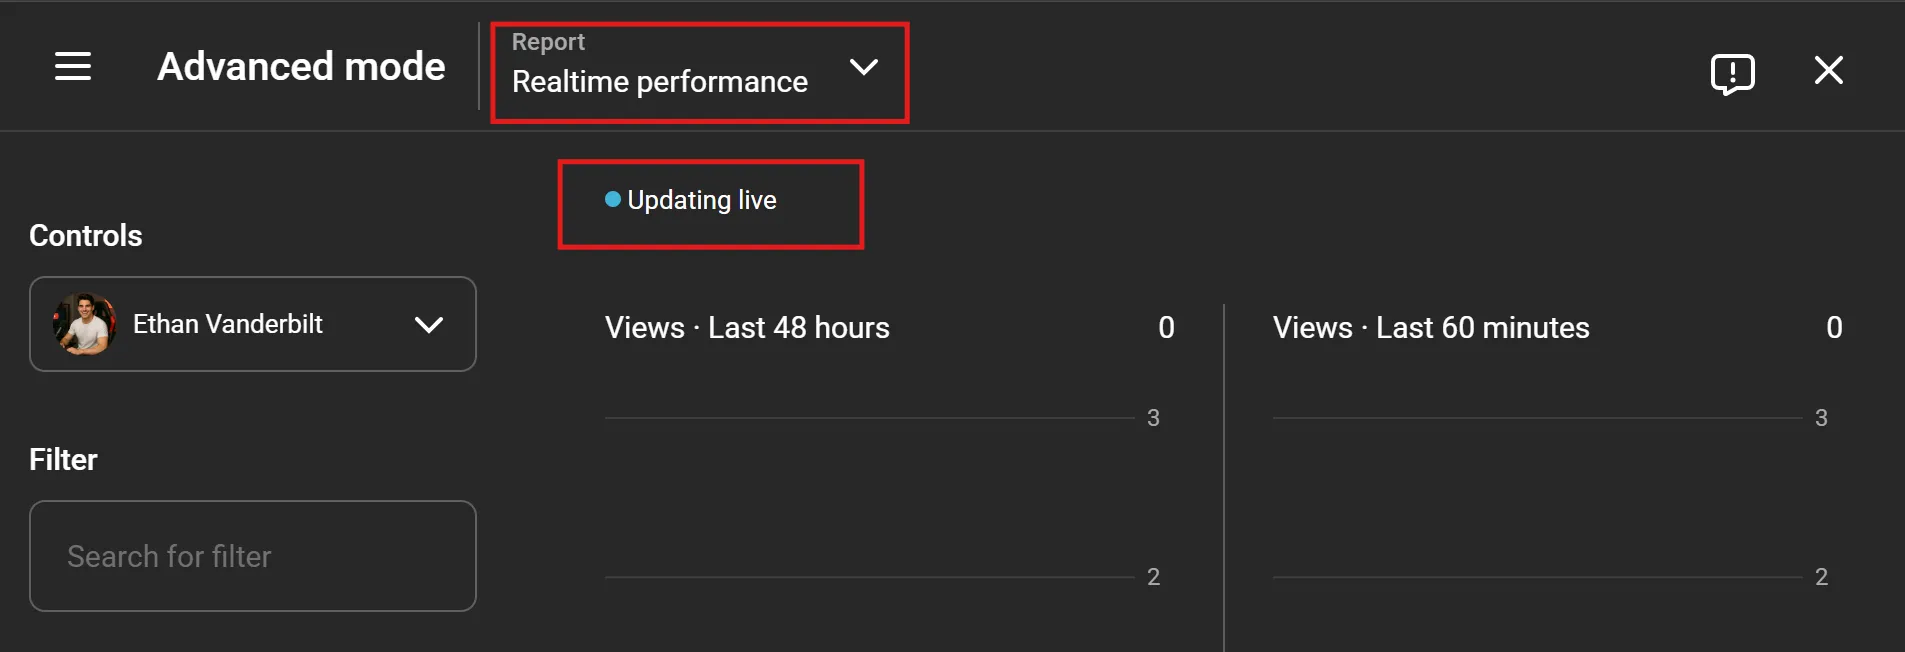
The “Real-time” report displays the total number of views your videos have received in the last 48 hours and the last 60 minutes. This is a quick way to check the performance of new videos or trending content.
In the case of new videos, this report can be used to determine the effectiveness of the video’s surfacing in recommendations, notifications, and external shares during the critical first exposure period.
The ongoing or older videos, can be used to identify re-emerging interest patterns, often associated with shifts in search demand or algorithmic surfacing. In addition to view metrics, the Real-Time report can be analyzed in conjunction with traffic source and geography information.
3. The Content Tab
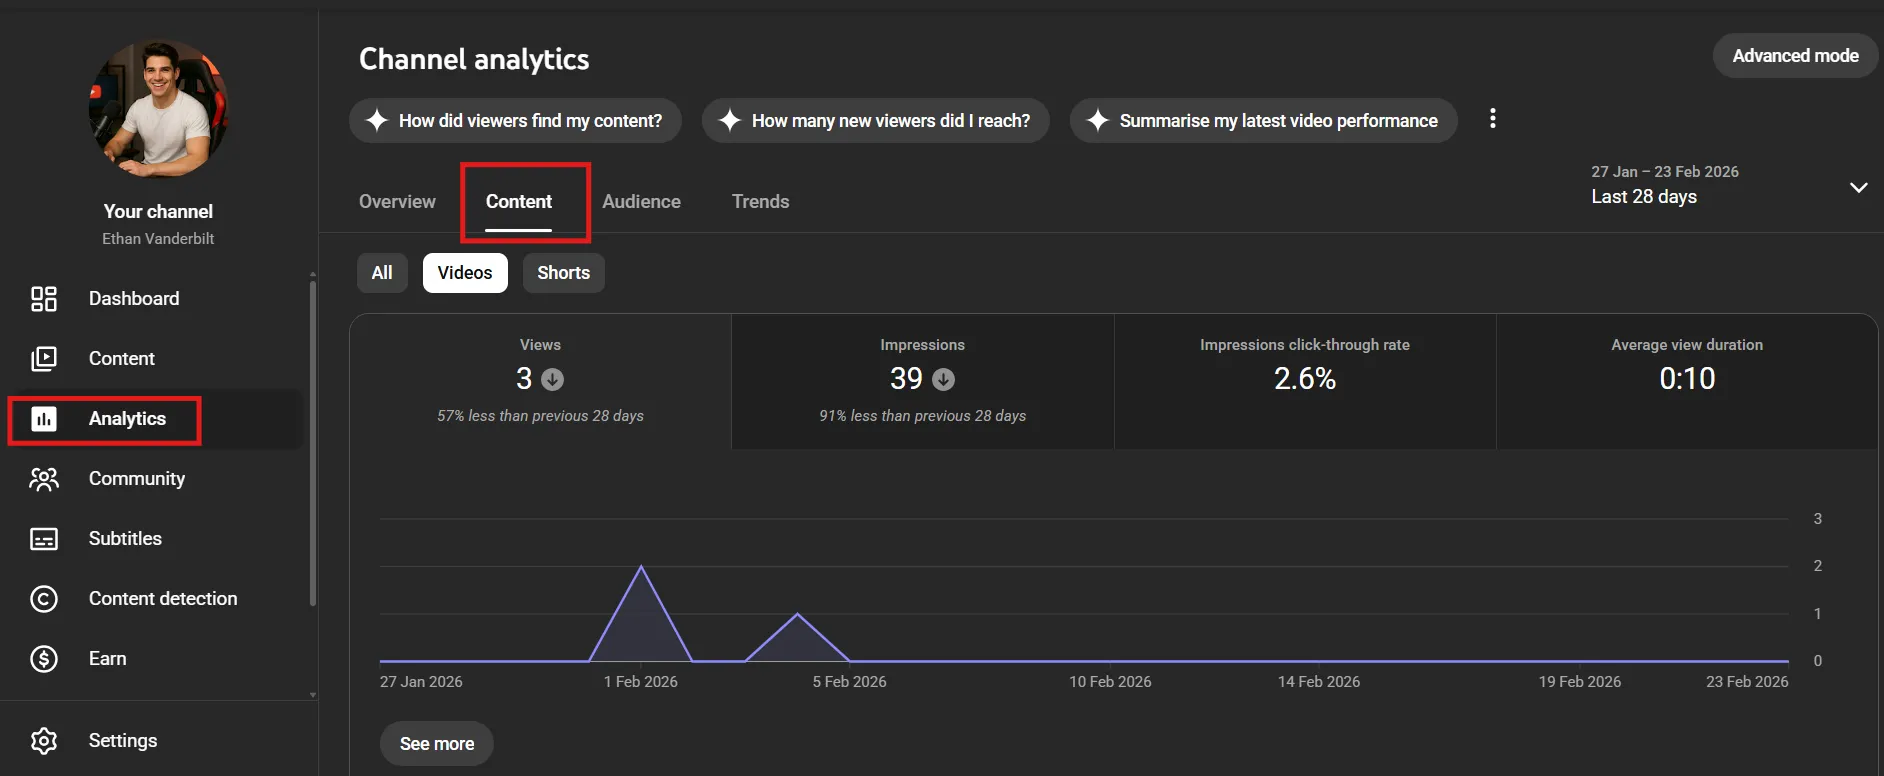
The ‘Content’ tab is where you can find information about how your videos, Shorts, and Live content are viewed and interacted with.
Impressions and Click-Through Rate (CTR)
- Impressions: This is the number of times your video thumbnails were viewed by YouTube users (e.g., on the homepage, in search results, or in the ‘Up Next’ section).
- Impressions click-through rate: This is the percentage of impressions that led to a user clicking on your video and watching it. This is an indicator of how attractive your video titles and thumbnails are.
4. Traffic Source in YouTube Analytics
This section will help you understand the sources of your opinions. Some of the common sources of traffic are:
- YouTube Search: Views from people searching for videos on YouTube.
- Browse Features: Views from the homepage, subscription feed, or ‘Watch Later’ feature.
- Suggested Videos: Views from videos suggested alongside or after other videos.
- External: Views from outside YouTube (such as social media sites).
5. The Audience Tab
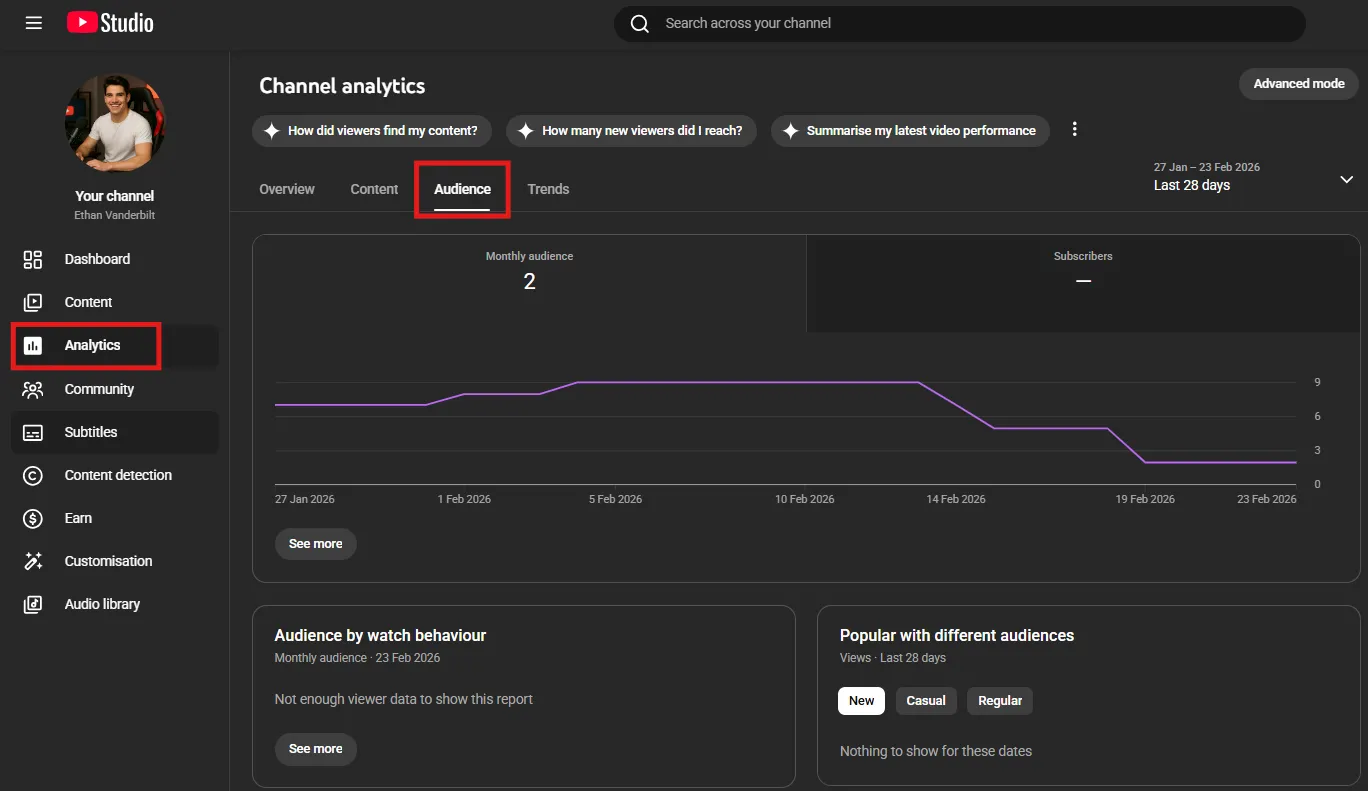
This is where you can learn more about your audience and gain insights into their behavior and demographics.
Returning vs. New Viewers & Unique Viewers
- New viewers: These are people who watched your channel for the first time during the chosen time period.
- Returning viewers: These are people who have watched your channel before and came back during the chosen time period. A good mix of both is an indicator of growth and loyalty.
- Unique viewers: This is the total number of people who have watched your videos, irrespective of how many times they have watched.
How to use YouTube Analytics
YouTube Analytics (within YouTube Studio) assists video creators in monitoring the performance of their channels using four primary tabs:
Overview (views, watch time, and number of subscribers), Content (impressions and click-through rates), Audience (viewer demographics/behavior), and Revenue.
The most important data points to evaluate are Average View Duration (AVD), traffic sources, and retention charts.
Accessing YouTube Analytics
- Desktop: Go to YouTube Studio and click Analytics in the left menu for channel-level information.
- Video-Level: Click Content in the left menu, then hover over a video and click the Analytics icon.
- Mobile: Open the YouTube Studio app and tap Analytics.
Key Tabs and Metrics to Track
- Overview: Offers a broad summary of views, watch time, and subscribers for a selected period.
- Content: Breaks down where your viewers are coming from, with impressions, click-through rate (CTR), and key moments for audience retention.
- Audience: Examines who is watching your content, with unique viewers, returning viewers, age, gender, and geography.
- Revenue: Monitors estimated earnings from advertising, memberships, and other sources.
Final Thoughts
As a content creator on YouTube, it is indispensable for you to understand YouTube analytics dashboard to grow your channel. Without this, expanding the reach of your channel to a newer audience will be similar to finding a needle in a haystack. It provides massive data points about your channel’s performance that you can use to grow your YouTube channel. To conclude, we gave insights and an overview on how to understand YouTube analytics, metrics nuances, and benefits, helping you grow your channel.
Frequently Asked Questions
Q1. What metrics should I track on YouTube Analytics?
You can focus on metrics like watch time, sources of viewers coming on your channel, key demographics, engagement rate, audience retention rate, and average view duration per video.
Q2. What Is The Most Important metric for a YouTube channel?
Watch time and audience retention are the most important metric for a YouTube channel as it affects every metric needed for growth and monetization.
Q3. Is YouTube Studio analytics free?
Yes, YouTube Studio is free, and every channel/account can use the feature completely free.
Q4. How long does YouTube Studio analytics takes to update?
You can use a combination of various techniques like creating high-quality content, crafting SEO-friendly video descriptions using an AI YouTube description generator, creating attention-catching thumbnails, organizing your playlists, and promoting YouTube videos. You can also explore a common practice to buy YouTube views, which can potentially increase your videos’ engagement rate.
Q5. What is the YouTube analytics summary?
The YouTube analytics summary shows you an overview of the critical data and insights into your channel’s performance. It provides a quick snapshot of the key metrics, such as total views, watch time, and subscriber count.